Meridian - Beyond NPS
The trip ends on Day 5.
The data runs for up to 18 months.
Every vendor will tell you the trip was a success. We'll show you exactly what changed - in your team, in your culture, in measurable behavior - from baseline through a full performance cycle. No one else in the industry does this. We checked.
What Is Meridian
Proprietary intelligence. Built for leadership teams that need proof.
Meridian is CDV's proprietary transformation tracking and intelligence platform. It begins before your team leaves and keeps measuring for up to 18 months after they come home - through performance reviews, annual planning, and full retention cycles.
The result is not a survey: it's a live AI-powered dashboard built to give your leadership a real-time view, plus a board-ready executive summary generated by our proprietary AI engine that connects program investment directly to measurable behavior change.
Built on a multi-model AI architecture - flagship language models combined with a retrieval-augmented knowledge base and a protected internal model trained on program data. For the first time, your CFO can see a direct line between the spend and the outcome.
18months
Maximum measurement window - through your full performance cycle
6phases
Pre-trip through 18 months of sustained change tracking
1dashboard
Live. Board-ready. Always on.
0friction
No app downloads. No logins. Surveys arrive where your team already works.
The Intelligence Layer
The first AI engine built exclusively
for corporate travel intelligence.
Every platform in the industry is adding AI chatbots and summary tools. We built something different - a proprietary intelligence engine designed from the ground up for one purpose: turning behavioral data from corporate travel programs into board-ready proof that the investment worked.
Multi-Model Architecture
Multiple flagship AI models working in concert - each optimized for a different part of the analysis pipeline. Sentiment extraction, narrative generation, pattern detection, and trend forecasting each run on the model best suited for the task.
RAG Knowledge Base
A retrieval-augmented generation layer trained on behavioral science research, organizational psychology frameworks, and program outcome data. The AI doesn't just summarize - it contextualizes your results against what the research says should happen.
Protected Internal Model
Your data never leaves a secure, isolated environment. A protected internal model processes sensitive participant responses without exposing them to third-party systems. Privacy by architecture, not policy.
The result: your board report writes itself. Open-text survey responses become structured executive narratives. Sentiment trends become retention forecasts. Raw data becomes the story your CFO needs to hear - accurate, sourced, and ready to present.
The Measurement Arc
Six phases. Up to 18 months. Zero gaps.
From the moment your team is briefed to 18 months after they return - Meridian tracks transformation at every milestone. No other platform in the industry goes past the post-event survey. We go through your entire performance cycle.
Pre-Trip
Before departure- ›Baseline team cohesion survey (psychometric baseline: methodology shared on request)
- ›Individual sentiment and engagement scoring
- ›Leadership alignment interview (30 min, async)
- ›Stated expectations capture - what does success look like to each participant?
- ›Anonymous peer relationship mapping
Click any phase to explore what we measure
Pre-Trip
Before departure- ›Baseline team cohesion survey (psychometric baseline: methodology shared on request)
- ›Individual sentiment and engagement scoring
- ›Leadership alignment interview (30 min, async)
- ›Stated expectations capture - what does success look like to each participant?
- ›Anonymous peer relationship mapping
During Trip
Daily on program- ›Daily pulse checks via mobile - 3-5 questions, under 90 seconds
- ›Per-activity ratings immediately after each experience
- ›Emotional highlight tagging ("what was the moment?")
- ›Guide and facilitator observations, logged in real time
- ›Conflict or friction signals monitored and flagged
Post-Trip
Within 72 hours- ›Full debrief survey - 15 questions, structured
- ›NPS (one data point among many, not the whole story)
- ›Transformation self-assessment against stated expectations
- ›Peer recognition prompts - who showed up differently?
- ›Open reflection: what will you do differently at work next week?
30 Days
30 days post-program- ›Behavior change self-report: are you doing the things you said you would?
- ›Team relationship delta - has it held? Improved further?
- ›Internal advocacy signal - have you told colleagues about the program?
- ›Manager observation prompt (for leadership programs)
- ›Retention and engagement micro-survey
90 Days
90 days post-program- ›Sustained change measurement vs. Day 0 baseline
- ›Leadership check-in: what's measurably different on the team?
- ›Retention signal - are the people still there? Still engaged?
- ›ROI narrative generation for board-level reporting
- ›Recommendation for next program cadence based on arc data
Extended Arc
6-18 months- ›6-month deep reassessment - full psychometric re-baseline vs. Day 0
- ›12-month annual cycle alignment - map transformation data to performance reviews and retention metrics
- ›18-month longitudinal view - the longest behavioral dataset in the incentive travel industry
- ›Year-over-year cohort comparison for organizations running repeat programs
- ›Export-ready data packages - download your full arc dataset and overlay it with your own internal metrics
- ›Executive trend report: is the investment compounding or decaying?
The Dashboard
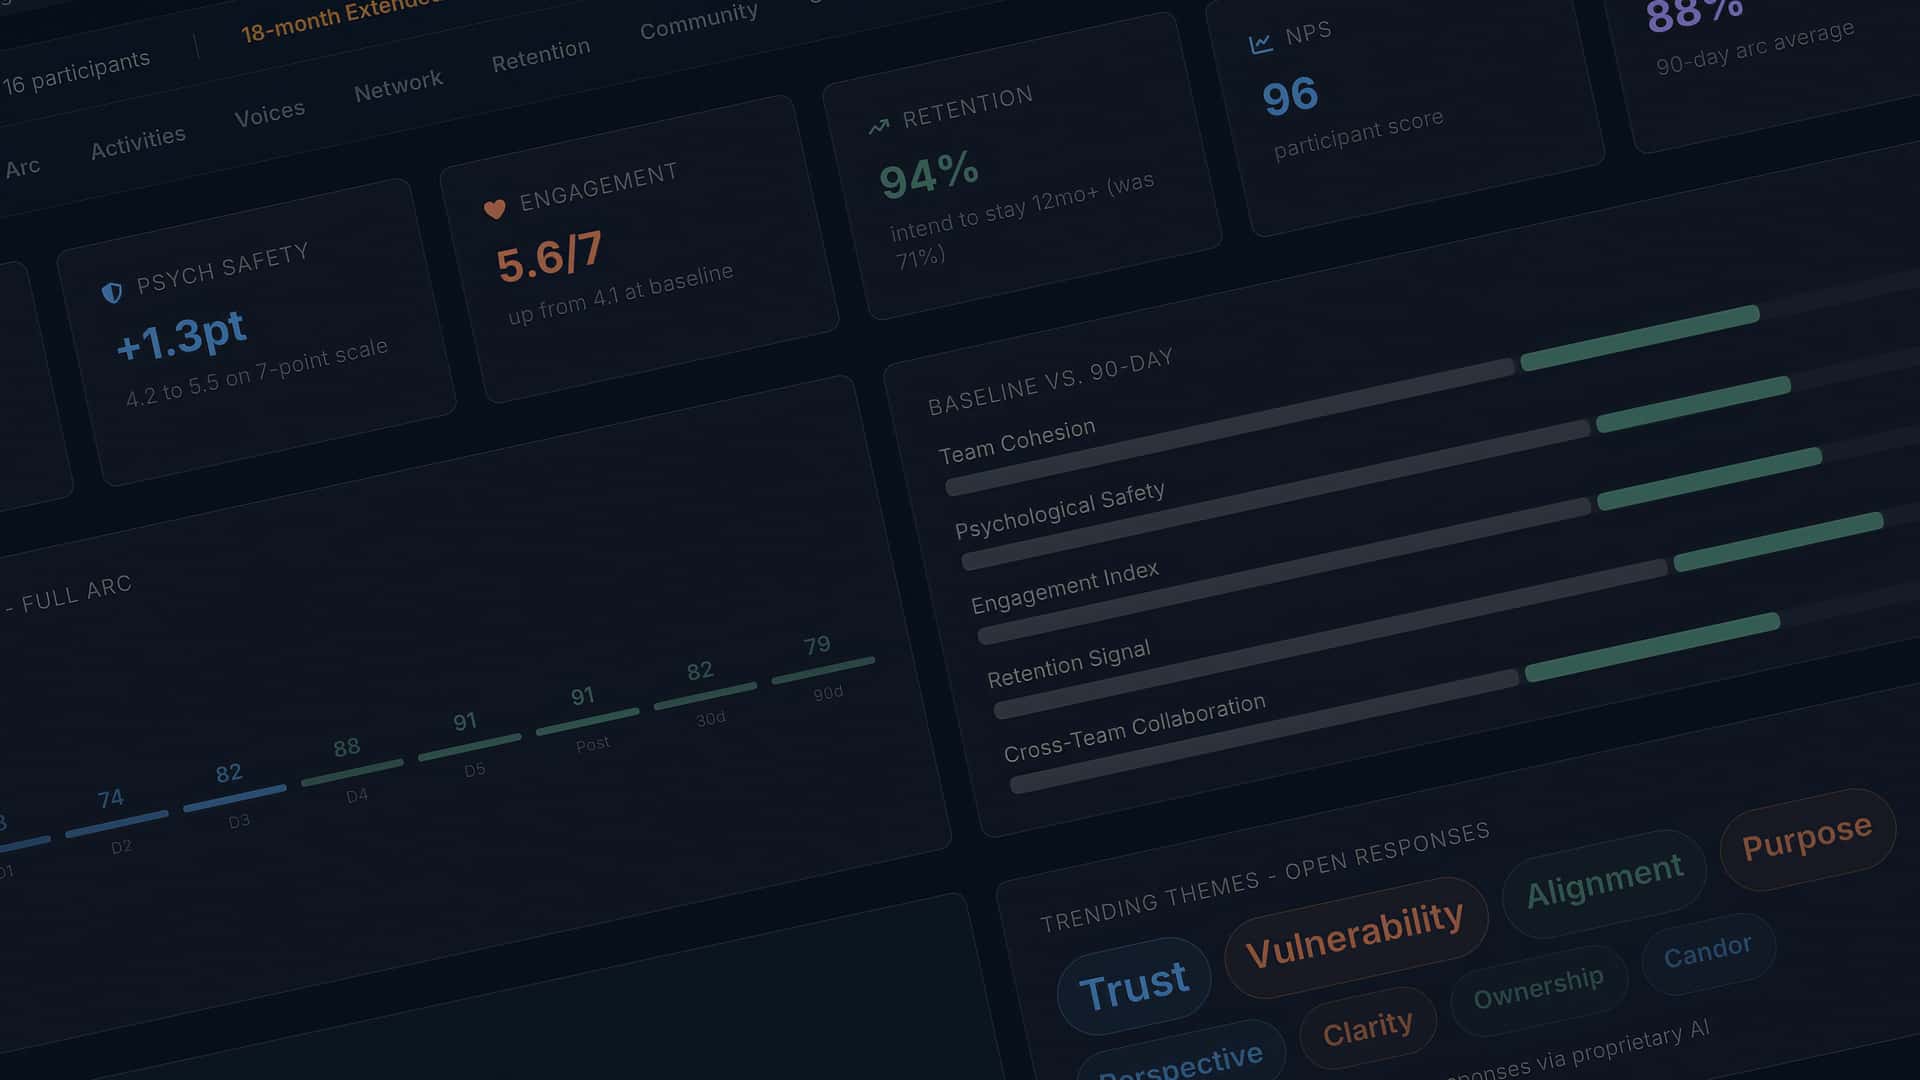
What leadership actually sees.
A live, board-ready intelligence platform - not a PDF sent three weeks after the program ends.
Team Cohesion
+42%
vs. baseline (3.8 to 5.4)
Psych Safety
+1.3pt
4.2 to 5.5 on 7-point scale
Engagement
5.6/7
up from 4.1 at baseline
Retention
94%
intend to stay 12mo+ (was 71%)
NPS
96
participant score
Completion
88%
90-day arc average
Sentiment Trend - Full Arc
Baseline vs. 90-Day
Community Impact
72% of spend stayed local. 34 businesses supported.
€47,200
Local impact
18
Family suppliers
Trending Themes - Open Responses
Extracted from 247 open-text responses via proprietary AI
AI Insight
Cohesion and psychological safety scores show minimal decay between post-trip and 90-day measurements (5.6/5.5 to 5.4/5.5). This is consistent with sustained behavioral change rather than post-event euphoria, which typically shows 30-40% regression by day 90. The engagement index actually increased at 90 days, suggesting compounding rather than decay.
Sample dashboard - data anonymized. Actual dashboard updates in real time throughout your program.
Competitive Advantage
Built for a question no one else is answering.
Most platforms measure the event. Meridian measures the people - before, during, and long after they come home. Here's what that actually looks like.
AI Narrative Engine
Powered by a proprietary AI stack - multiple flagship models combined with a retrieval-augmented knowledge base and a protected internal model trained on program data. Raw survey responses become structured executive narratives - editable, exportable, board-ready. No analyst required.
Predictive Retention Signals
AI-driven pattern recognition across pre-trip baselines, 30-day, and 90-day engagement data flags who is at flight risk before they update their LinkedIn. HR gets a signal, not a surprise.
Network Relationship Mapping
AI processes anonymous peer recognition data into a live connection graph - showing which relationships strengthened, which teams became more cohesive, and where isolation signals exist.
Slack & Teams Integration
Pulse surveys delivered where your team already works. No separate app download required. Completion rates go up. Friction goes to zero.
Cohort Year-Over-Year Tracking
Run a program in 2025. Run another in 2026. With 18-month extended arcs, Meridian shows you exactly what carried forward, what regressed, and what your program cadence should be to sustain change.
ESG & Sustainability Reporting
Community impact data - local economic retention, family supplier network, carbon offset estimates - packaged directly into your corporate sustainability report. One program, two reports.
Custom KPI Integration
Export your full arc dataset in any format - Excel, CSV, PDF, or via API. Your team overlays Meridian data with internal performance metrics - pipeline velocity, quota attainment, eNPS - to close the attribution loop on your terms.
Live Sentiment Feed
AI-powered sentiment analysis gives your CDV program director a real-time dashboard during the program. If energy drops, we adjust before the moment is lost - not after the survey comes back.
Open Data Export
Your data is yours. Export to Excel, CSV, or PDF with one click - or connect directly through our API if your team wants to build on top of it. No lock-in. No gatekeeping.
Biometric-Ready Architecture
For programs that want to go deeper - optional wearable integration captures stress, recovery, and engagement signals during high-intensity activities. Coming 2026.
NPS vs. Meridian
One number. Or the whole story.
Traditional NPS Survey
Sent once, 72 hours after the program ends.
92
NPS
One data point. One moment in time.
"Did people enjoy themselves?" - useful, but it doesn't tell you what changed, whether it lasted, or whether it was worth the investment.
Intelligence Platform
Continuous measurement from Day 0 through 18 months.
Team Cohesion Delta
+34%
Behavior Change (30d)
78%
Leadership Trust
+29pt
Retention Signal
94%
Peer Recognition Index
8.7/10
Sustained Change (90d)
71%
Community ROI
72%
Survey Completion
94%
Did the experience change behavior? Did it last? Is your team more cohesive, more trusted, more retained? Now you know.
"NPS tells you if people liked it.
- CDV Measurement Philosophy
Meridian tells you if it meant anything."
Industry Reality
We didn't build Meridian to be different. We built it because nothing else existed.
We researched every major platform in the corporate travel industry. Here's what we found.
74%
of organizations don't include any ROI metrics in their events policy
Source: Amex GBT 2026 Global Meetings Forecast
0
platforms in the corporate travel industry offer longitudinal behavioral tracking past the post-event survey
Source: CDV competitive analysis, March 2026
1
platform tracks your people from pre-trip baseline through 18 months post-program
That's Meridian.
“We don't measure it exactly, relative to the investment.”
- CEO quoted in the Incentive Research Foundation's flagship study on incentive travel effectiveness
The biggest platforms track registrations, room blocks, and session attendance. Meridian tracks whether your people actually changed.
Some vendors talk about measuring impact at 3, 6, or 12 months. None of them have built the platform to do it. We did. Meridian runs from pre-trip psychometric baseline through 18 months of sustained change tracking - with a live dashboard, board-ready reporting, and data your CFO can actually use. Ask the other vendors to show you their longitudinal data. Then ask us.
Join the Meridian WaitlistCommunity Impact
Your investment reaches further than your team.
Meridian tracks community impact alongside team impact. On every CDV program, you'll see exactly how much of your spend stayed in the destination community - supporting local families, businesses, and artisans rather than multinational chains.
70%+
Of every dollar stays local
100%
Locally-owned family partners
Zero
Supplier commissions or kickbacks
Sample Report
See what your board will actually receive.
Request a sanitized sample Meridian report - real data structure, real dashboard layout, real executive summary format. We'll also walk you through how participants experience the measurement arc so you know exactly what to expect.
Business Case Tool
Calculate the ROI of your program
Enter your headcount, average compensation, program duration, and investment. The calculator shows replacement cost exposure, productivity value at three confidence levels, your ROI percentage, and the performance improvement threshold at which the program pays for itself. Every formula is visible. Every statistic is cited.
Open the ROI CalculatorMeridian - Common Questions
Ready to measure what actually changes?
Join the Meridian waitlist for first access at launch, plus a sample report so you can see exactly what your board will receive.